×
Menu
Index

Example: Remuneration Structure

Example: Remuneration Structure
 
 
1

Job title

1. Job title
Use this field to identify the particular model used as the basis for the structure.
 
In this example the field has been used to identify the two market segments from which data is sourced in the model.
2

Company/Employer

2. Company/Employer
The name of the Company/Employer or subsidiary to wihch the remuneration structure applies
3

Survey

3. Survey
The survey from whihc data has been extracted to form the basis of the Remuneration structure
4

Chosen market position

4. Chosen market position
The market position on which the remuneration structure is based.
5

Remuneration bands

5. Remuneration bands
Table showing the calcualted Bands derived from the parameters selected.
 
To modify the structure after it has been generated, edit the Draft framework or the selected parameers adn regenerate the report.
6

Internal value

6. Internal value
The points range defining each Band.
 
The Midpoint defines the point at which the Midpoint remuneration value is calculated from the selected market parameters.
7

Remuneration range

7. Remuneration range
The calculated remuneration range for each band, comprising:
 
  • -Range:
  • The percentage below the Midpoint at which the Minimum is calculated
     
  • Minimum:
  • The Minimum remuneration value, defined by the -Range value
     
  • Midpoint:
  • The Midpoint vlaue is calculated directly fromt he Midpoint positns vlaue and the selected market data
     
  • Maximum:
  • The Maximum remuneration value, defined by the +Range value
     
  • +Range:
  • The percentage above the Midpoint at which the Maximum is calculated
8

Remuneration chart

8. Remuneration chart
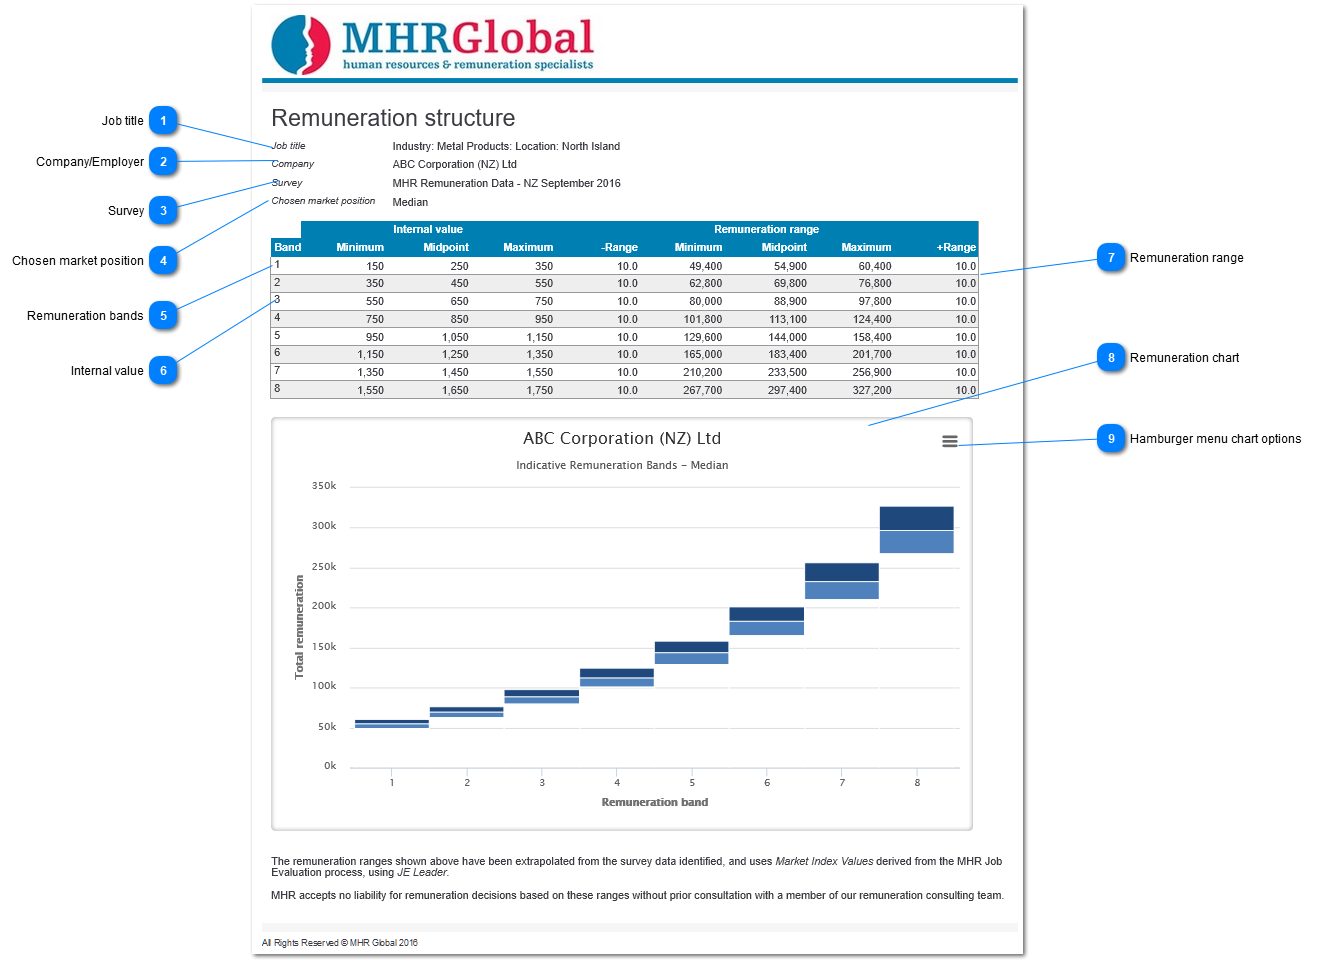
Chart illustrating the relationship between Bands.
 
This chart can be used to review structures, to help redefine rhe design of individual Bands, to ensure sensible progression between Bands.
 
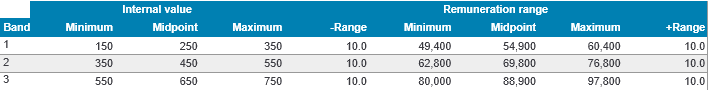
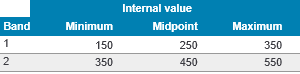
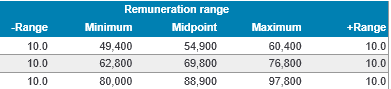
It may be necessary to refine the Band structure by modifying points ranges or the values used to calculate the Minimum and Maximum of each Range.
 
Where proegression between Bands is desired, it may be useful to ensure there is a degree of overlap between neighbouring Bands, to mimimise any differential between current remuenration and remuneration in the new band. This may require modfifcation of the structre, by adding new bands, or varying the design of Bands to create an overlap.
9

Hamburger menu chart options

9. Hamburger menu chart options
Use the hamburger menu to print the chart directly to a local printer, or export the chart to one of several available graphics formats.