×
Menu
Index

Pay Practice Analysis Report


Report Overview:

 
Use the Pay Practice Analysis report to check the relationship between your remuneration levels and a selected market segment.
 
Note that the report is restricted to those roles for which data has been submitted by your organisation and in which the sample in the selected market segment is sufficiently high to provide viable data analysis.
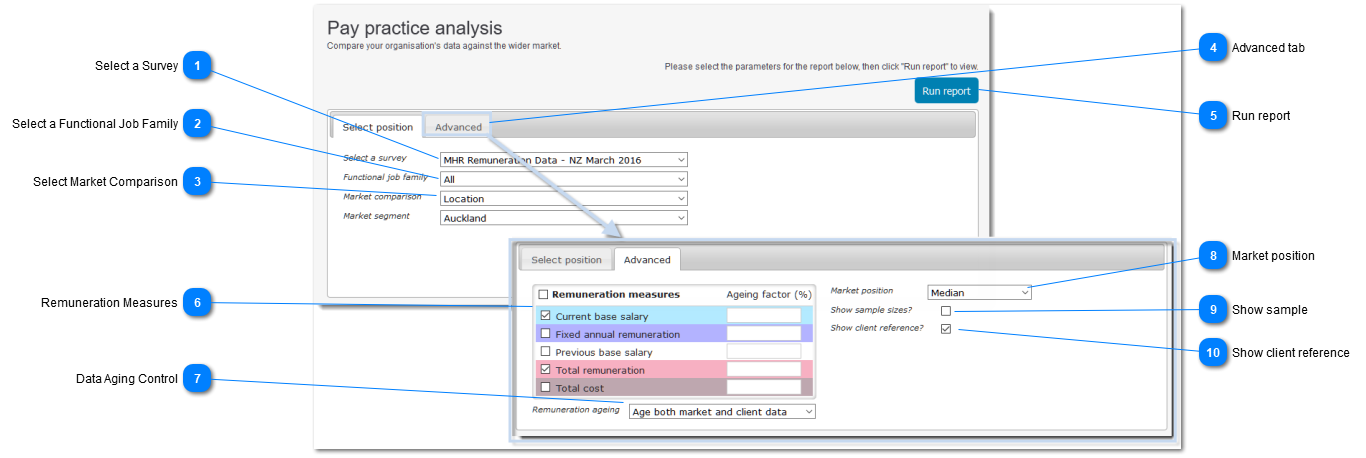
 
Pay Practice Analysis Report
 
 
1

Select a Survey

Select the survey from which data is required.
 
The most recent survey shown will be the most recent survey to which the organisation has contributed data.
2

Select a Functional Job Family

Use the drop-list to select "All functional groups" or a specific functional group of interest
3

Select Market Comparison

Use the drop-list to select the required market comparison.
 
Where a market comparison other than "All organisations" is selected (e.g. "Industry" or "Employees") a fourth field will be displayed to allow a choice of a specific segment within that comparison group.
 
Note that the default comparison for the selected criteria is with the market Median (i.e. middle of the market). To select a different point of comparison use the "Advanced" button.
4

Advanced tab

Use the "Advanced" button to select other criteria for your report:
 
  • Aging factors to allow data to be aged to adjust for movements which may have taken place since the survey was completed
     
  • Selection of a market stance other than "Median" (e.g. Upper Quartile)
     
  • Change the report currency from the local currency which is the default.
5

Run report

Click to generate and view the report based on your selected criteria.
 
Once the Report is generated on screen, the Report can be prointed using the browser print options, or exported to excel for further analysis using the "Generate Excel" button below the report.
6

Remuneration Measures

6. Remuneration Measures
 
Select the Remuneration Measures to be displayed on the report by checking the box.
  • Select all measures by selecting the box tot he left of the Header
     
Age the data by applying a percentage adjsuytment to selected Remuneration Measures
  • For example, age (increase) the data by adding 2.0 percent to each measure to take account of movement since the survey was released.
7

Data Aging Control

7. Data Aging Control
Usee the droplist to apply the aging factir to:
  • Market data only
  • Client data only
  • Both market and client data
 
8

Market position

8. Market position
Use the droplist to select the preferred Market position
  • Lower Quartile
  • Median
  • Upper quartile etc.
9

Show sample

9. Show sample
Check the box to include the sample for each record
10

Show client reference

10. Show client reference
Check the box to include the Client reference to help identify individual records