The Average compa ratio is calculated from all the records included in the report. Ideally this should be close to 100.0, showing close alignment to the chosen market.
Note however that while the Average may show that overall an organisation's pay practice appears to be close to market practice, there may be wide variation in individual records, with very low Compa ratios being offset by very high ratios.
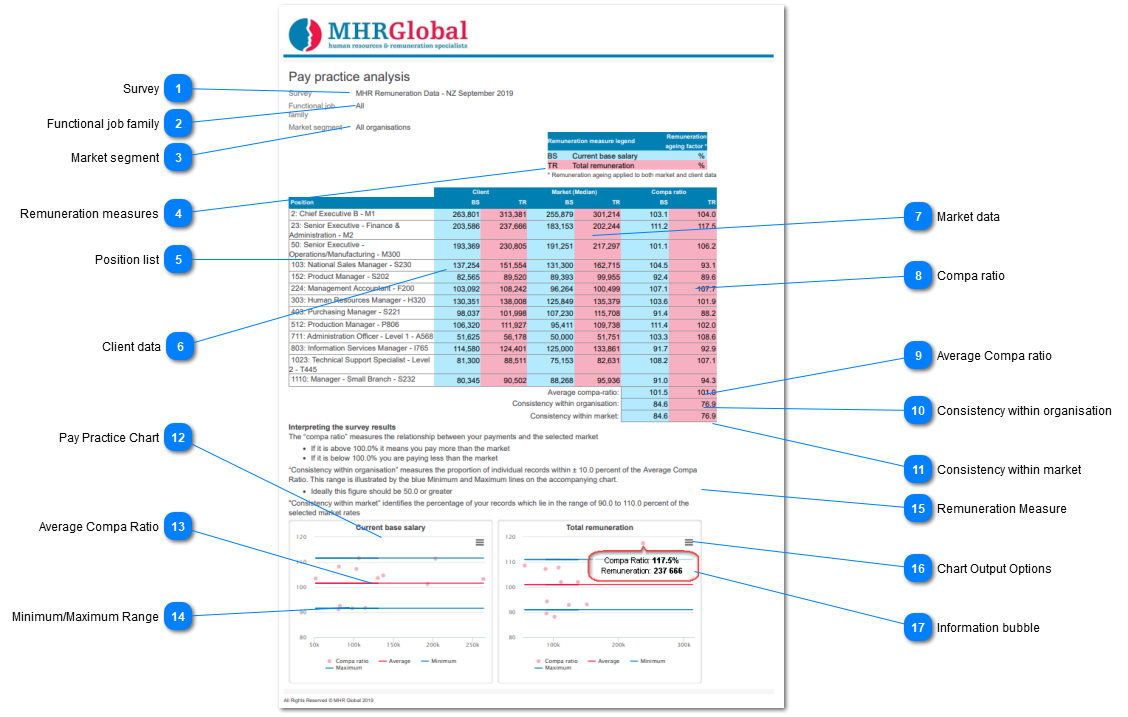
The two Consistency Indices discussed below put the average into context, by indicating how many records fall within an acceptable range of the organisation average.
This index shows the proportion of records which fall within a range of 10.0 percent either side of the Average Compa Ratio. In the example the figure for Base Salary is 61.5. This means that 61.5 percent of the records have a Compa ratio which falls between 87.7.5 and 107.7.
For Total Remuneration the ratio is also 61.5.
While individual records will show variation in the Compa ratio the Consistency indices allow an assessment to be made on whether this has been achieved through consistent market alignment, or through wide variation and compensatory variations. An index of 50.0 percent or more suggests a high level of consistency.
Similar to the Consistency within organisation index, this index measures the consistency within the selected market, showing the proportion of records in which the Compa ratio falls between 90.0 and 110.0 percent of the market value.
Ideally the index would fall at 50.0 percent or higher. An index which is lower than this may require reconsideration of the selected market comparison, or adjustment of the market position chosen.
Alternatively it may simply be identifying a high level of anomalies and inconsistencies in your current alignment with the selected market, and require adjustments to remuneration practice to be made to address these.
The chart shows the Average Compa Ratio (the red line), and the suggested Minimum and Maximum ranges (the two blue lines), with the individual Compa Ratios for each record.
This gives a very clear picture of how closely practice aligns with the selected market segment.
The blue lines define a range 10 percentage points above and below the Average for the organisation.
A consistent Remuneration practice would typically result in a minimum of 50 percent of records falling within this "range of tolerance".
Records which fall outside this range are not necessarily incorrect, however may warrant further review to ensure that the reasons for paying outside the typical range do stand up to scrutiny and can be justified.
Use the hamburger menu to print the chart directly to a local printer, or to export to one of several graphics formats. The exported file can then be included in other documents.