Example: Market Rates Report
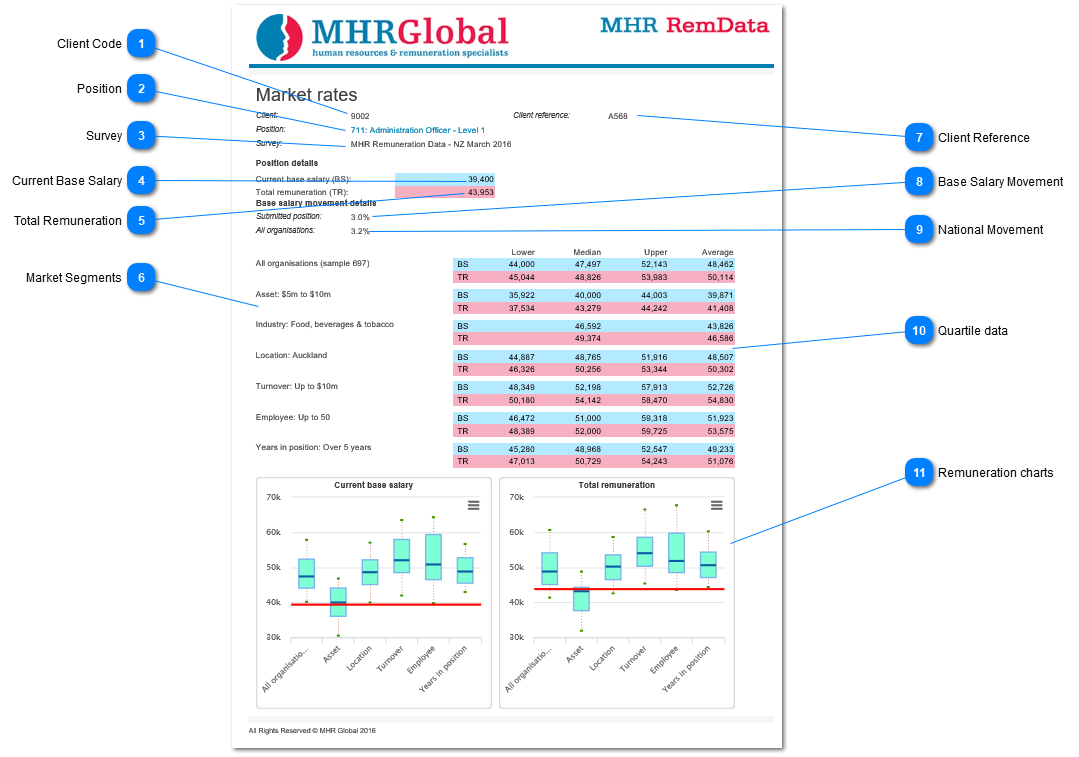
 Client CodeUnique Client Code, used for all processing and analysis.
|
|
 PositionMHR RemData survey position code and designation.
Click on the name in the web view of the Report to view the position description used for this role.
|
|
 SurveyThe specific survey from which data is extracted
|
|
 Current Base SalaryThe Base Salary currently paid to the job holder by the organisation
|
|
 Total RemunerationThe value of the Total Remuneration package paid to this employee by the organisation.
This includes the value of Base Salary plus all benefits.
|
|
 Market SegmentsAnalysis of market segment data, including:
-
National data ("All organisations") -
-
Note that these will change depending on the survey the record relates to
-
The sample in each market segment is displayed in brackets if this option has been seected in the Advanced Tab
|
|
 Client ReferenceA unique reference provided by the Client, allowing the individual record to be recognised and identified.
|
|
 Base Salary MovementThe movement in Base Salary awarded to the job holder by the employer in the twelve months ending on the survey date.
|
|
 National MovementThe average increase received by people in this role nationally in the past twelve months
|
|
 Quartile dataQuartile data for the Market Segments listed
|
|
 Remuneration chartsCharts showing the comparison between the organisation payments and each of the market segments listed:
-
The dark blue segment of each bar shows the range between the Lower Quartile and the Median
-
The lighter blue segment shows the range between the Median and the Upper Quartile -
By definition exactly half the records in the sample fall in the range covered by the coloured bar
-
The red line shows where the organisation is currently paying this employee.
Note: Hover over a chart element in the web view of the report to view the underlying data.
|
|