×
Menu
Index

Interactive Charts

 
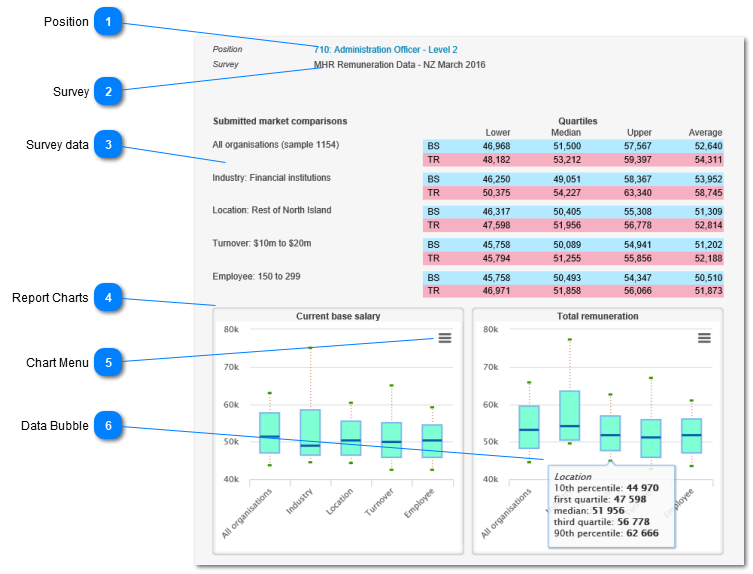
Many of the Reports included in MHR RemData incorporate charts based on the data displayed in the report.
 
The web versions of these charts are interactive, and can provide a quick means of viewing key data, without reference back to the accompanying tables.
 
The charts can also be printed separately from the report in which they appear, and can be saved in a range of graphics formats, for inclusion in documents created by the user.
 
The examplle beow is from the Select a Market Comparison report in the General Reports group.
 
Interactive Charts
 
 
1

Position

1. Position
The survey position selected for the report
2

Survey

2. Survey
The specific Survey from whic data has been sourced
3

Survey data

3. Survey data
The survey data selected using the Repoirt filters and other criteria
4

Report Charts

4. Report Charts
The interactive chart (or charts) for the selected report
5

Chart Menu

5. Chart Menu
Click on the "hamburger" menu on any chart to:
 
  • Print the chart directly to a local printer
     
  • Export the Chart to one of several graphics formats:
  • PNG Image
  • JPG Image
  • PDF Document
  • SVG Vector Image
6

Data Bubble

6. Data Bubble
The data bubble summarises key data for the chart element under the curser.
 
This data will change depending on which report and which chart is being viewed.