×
Menu
Index

Indicative Pay Ranges Report


Report Overview:

 
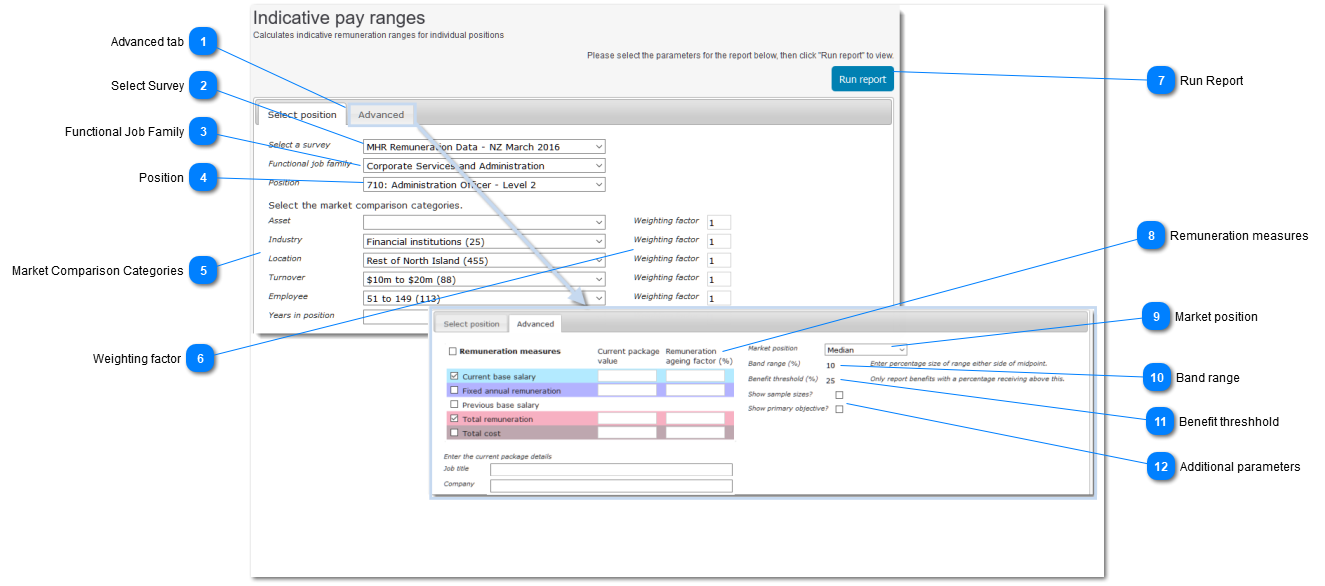
The report calculates indicative remuneration ranges for individual positions, based on criteria selected by the user.

This report is particularly useful when recruiting, or as the basis for a review of remuneration for existing staff, as it provides a means of establishing the market range for a role without the need for time-consuming position analysis.
 
Indicative Pay Ranges Report
 
1

Advanced tab

Use this tab to select Advanced options:
 
  • Include Primary Objective for the role as a header on the report
  • Change the Quartile analysis reported from the default value (Median) to a different Quartile option
  • Select the percentage value used to define a remuneration range
  • the default report uses 10 percent either side of a midpoint value derived form the selected market segments
  • Change the threshold against which Benefits are provided
  • Benefits will only be reported where the proportion of the national sample receiving a Benefit exceeds the stated figure
  • The default value is 25 percent.
2

Select Survey

Select the Survey of interest
3

Functional Job Family

Select the Functional Job Family for the role of interest
4

Position

Select the survey role of interest
5

Market Comparison Categories

Use the drop-lists to select the market comparison categories ("market segments") which are of interest.
 
Typically:
 
  • For Top Executive roles you would include Asset, Industry, Turnover and Employees
     
  • For General Staff roles you would include Industry, Location, Turnover and Employees
  • this reflects the fact the few General Staff roles have a significant direct impact on the Asset value of the organisation
 
The report will include each of these market segments, along with the national ("All organisations") data.
6

Weighting factor

6. Weighting factor
Apply a weighting factor (typically 2 - 3) to increase the influence of one or more market segments on the final result.
 
7

Run Report

Click to view and print report.
 
8

Remuneration measures

8. Remuneration measures
Use this panel to:
 
  • Select the Remuneration meausres to be include don the report
  • Enter the currnet remunerastion being recievdd by the job holder
  • Enter a remuneration aging factor
9

Market position

9. Market position
Use the droplist to select the Market position for which data is required
10

Band range

10. Band range
Enter the percentage used to calcuate the rnager either side of the derived Midpoint.
 
The defualt vlaue is set to 10.0 percent. This produces a range of 90.0 to 110.0 percent of the Midpoint value.
11

Benefit threshhold

11. Benefit threshhold
Enter the percentage at whihc Benfits wil be reports. The report wil show only those Benefits which are received by a proportion of the sample above the set percentage.
 
The defualt vlaue is set to 25.0 percent
12

Additional parameters

12. Additional parameters
Select additional report contents here.