×
Menu
Index

Example: Indicative Pay Ranges Report

 
Example: Indicative Pay Ranges Report
 
1

Job Title

The job title used within the organisation (if it has been entered in the Advanced options)
2

Company

The Employer name
3

Current Remuneration

3. Current Remuneration
Colour-coded legend identifying the current Remuneration paid to the job holder (if entered in Advanced options)
4

Position

The selected position:
 
  • Click on the link to view the full Job Description
5

Survey

The selected survey from which data is sourced
6

Chosen Market Position

6. Chosen Market Position
The position in the market range at which comparisons are being made.
 
The default value is Median (as illustrated) however the Advanced options allow other choices to be made.
7

Market Data Table

This table shows:
 
  • The selected quartile Base Salary and Total Remuneration for four market segments within which 
    the organisation operates 
  • The average Base Salary and Total Remuneration for each market segment is also shown for 
      comparative purposes 
 
  • At the foot of each column the four segments are averaged provide an indication of typical remuneration for
      a role which spans all four segments 
 
  • A "Weighting factor" which allows added emphasise to be given to a specific market segment is also available:
  • Where a weighting is applied, that segment will have increase influence on the final outcome
  • In the example given applying a weighting of 2 to the Industry data would increase the Midpoint
    value slightly
     
8

Weighting

8. Weighting
Enter a weighting to provide additional emphasis for one or more market segments. A weighting of '2' will increase the influence of that market segment on the derived Midpoint of the range.
 
The impact of applying a weighting is very much dependent on the extent to which the market data for the selected segment differs from the average value for all segments: the larger the difference the greater the impact of applying a weighting will be.
 
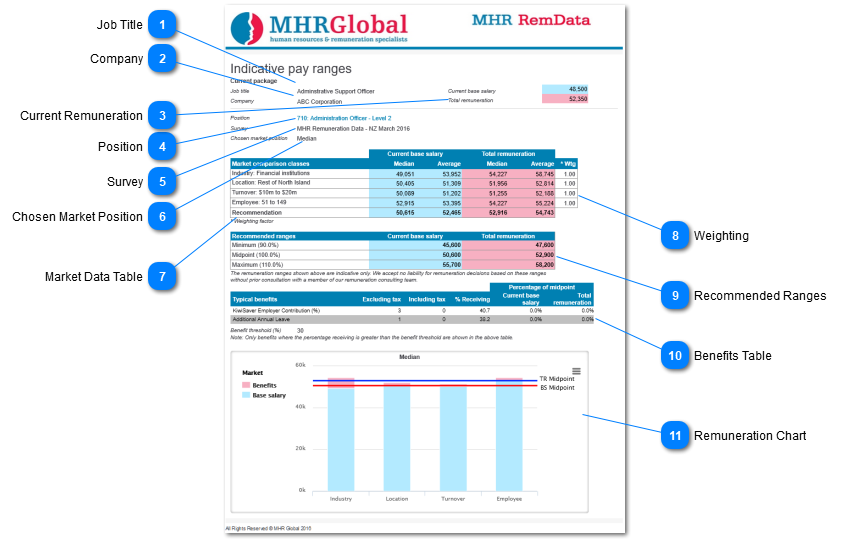
In the example above the difference is not great (about $4 000 for Industry); a weighting of "2" therefore has minimal impact.
 
Note: A weighting of "0" will remove that market segment from the calculation of the midpoint. The data will still be displayed, however the derived midpoint will not take that segment into account.
9

Recommended Ranges

9. Recommended Ranges
Table 2 shows:
 
  • A midpoint value for a Base Salary range and Total Remuneration range is calculated from the averages of  columns 2 and 4 in the previous table 
  • In the interests of simplicity this average figure has been rounded to the nearest $100 
 
  • A range has then been developed at a pre-set percentage above and below this midpoint 
  • This percentage is determined by the selection made on the Advanced screen
  • the default value is 10 percent
10

Benefits Table

10. Benefits Table
A summary of the key benefits provided in the role nationally.
 
Benefits are included only where the proportion of employees receiving the benefit nationally exceeds the "Benefit threshold" set in the Advanced options screen.
In this case the threshold has been set to 30 percent. 
11

Remuneration Chart

The chart illustrates the market value for each segment and the derived midpoint values for the calculated Indicative Pay Range.
 
In this example:
 
  • The blue segment of each bar depicts the value of the Base Salary element for each segment
     
  • The salmon segment depicts the value of benefits provided
     
  • The red line illustrates the derived Midpoint Base Salary value
     
  • The blue line lustrates the derived Midpoint Total Remuneration value.